Soil is one of the most important resources for food production; it regulates and supports ecosystem functions. However, for soil to sustainably perform its functions, it is crucial to understand its potential and limitations.
IFDC experts, Yuga Mario Enock and John Wani Gonda, published the article, “Soil Fertility and Farming Systems Assessment in Productive Areas of Western, Central and Eastern Equatoria State, South Sudan” in the Suntext Review of Arts & Social Sciences. This publication discusses the soil fertility and farming systems study carried out in the farming areas of Magwi, Juba, and Yambio counties of South Sudan from November to December 2021. Based on a thorough analysis of the study, Enock and Gonda issue recommendations for sustainably increasing crop yields and enhancing agricultural productivity, therefore, helping smallholder farmers improve their livelihoods.
Read the article summary or access the full-length PDF below.
Summary
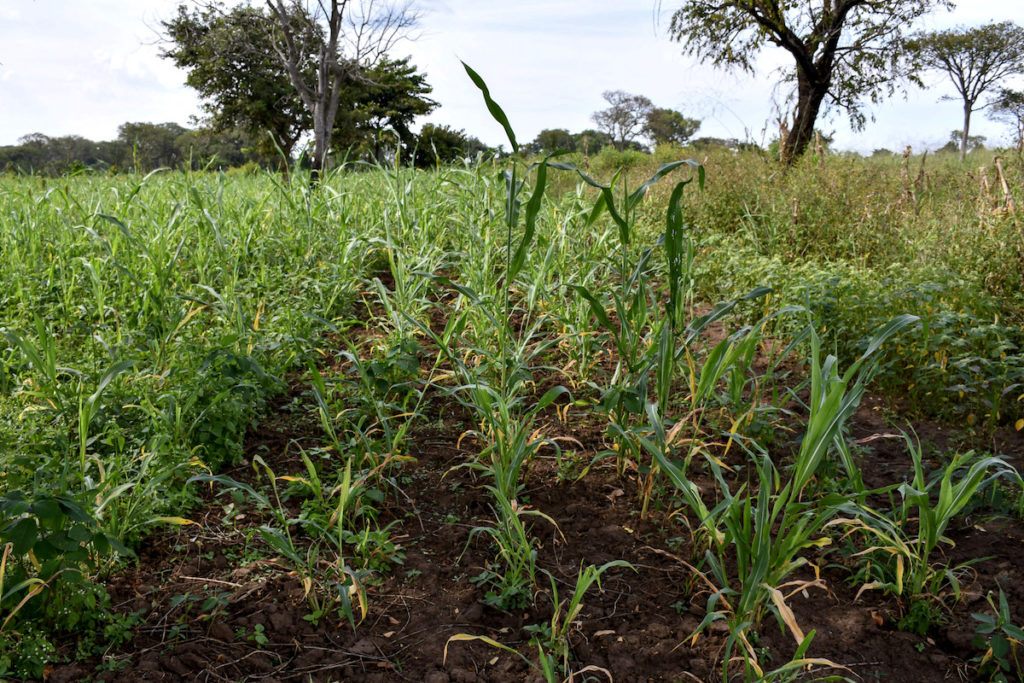
South Sudan continues to grapple with hunger and low crop productivity in multiple locations. One major contributor to this is declining soil fertility, often with no fertilizer addition to replenish the nutrients taken up by the harvested crops (nutrient mining).
Increasing the productivity of smallholder farmers requires a good understanding of the soil quality and prevailing farming conditions, such as economic, biophysical, and socio-economic constraints that hinder reaching the potential yields. Most farmers do not return crop residues to the fields after harvest, nor do they apply mineral or organic fertilizers to their fields. Mineral fertilizers are essential to boost crop yields, but they are expensive in South Sudan. In addition, they are not readily available to rural farmers, because of poor linkages to agro-input dealers and extension systems, which provide technical knowledge on fertilizer selection, storage, and application.
To deal with the issue of declining soil fertility on smallholder farms, scientific evidence is needed to identify the level of soil nutrients and then match this with site- and crop-specific recommendations. The Accelerating Agriculture and Agribusiness in South Sudan for Enhanced Economic Development (A3-SEED) project, funded by the Embassy of the Kingdom of the Netherlands in South Sudan, supported an assessment of the soils in the agricultural areas of Magwi, Juba, and Yambio counties in South Sudan.
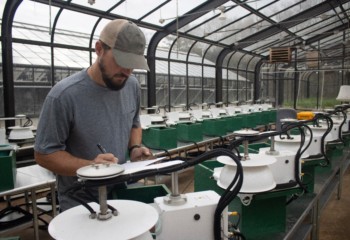
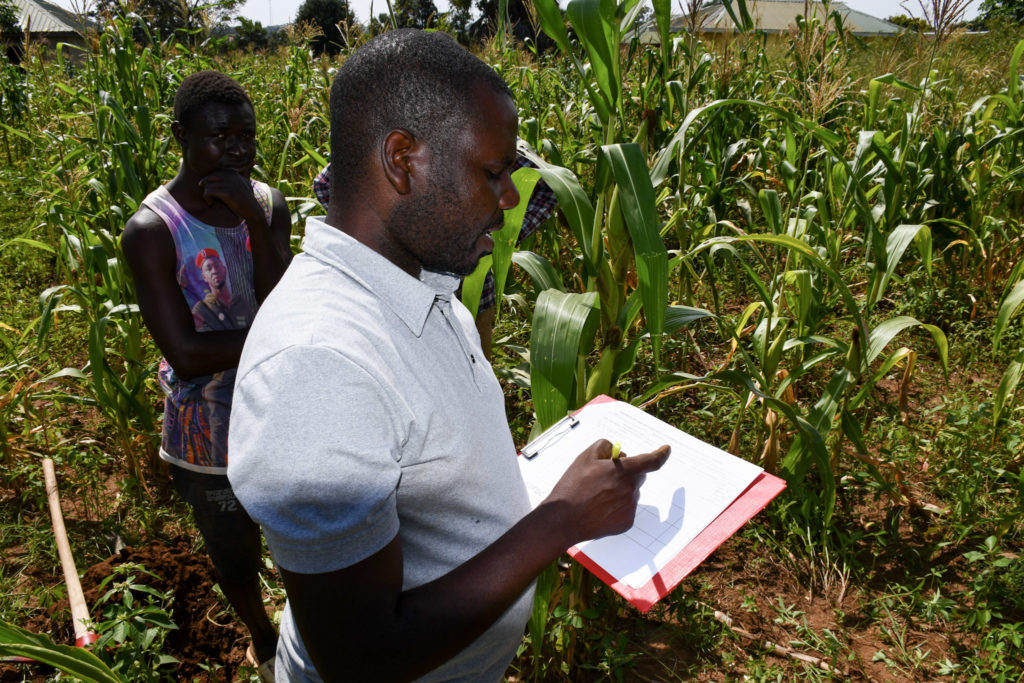
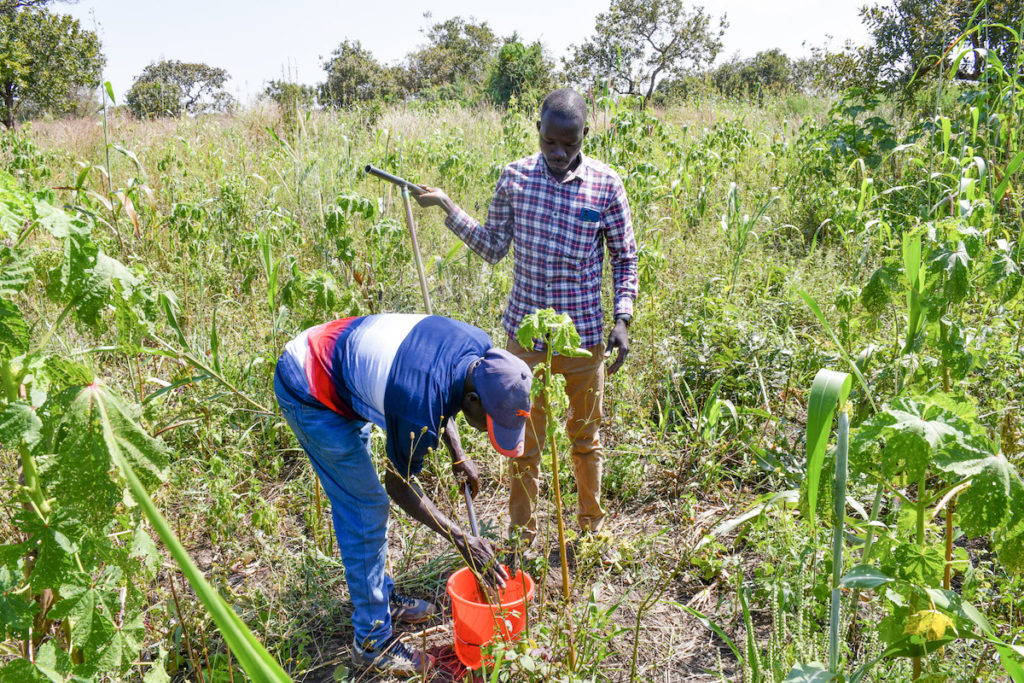
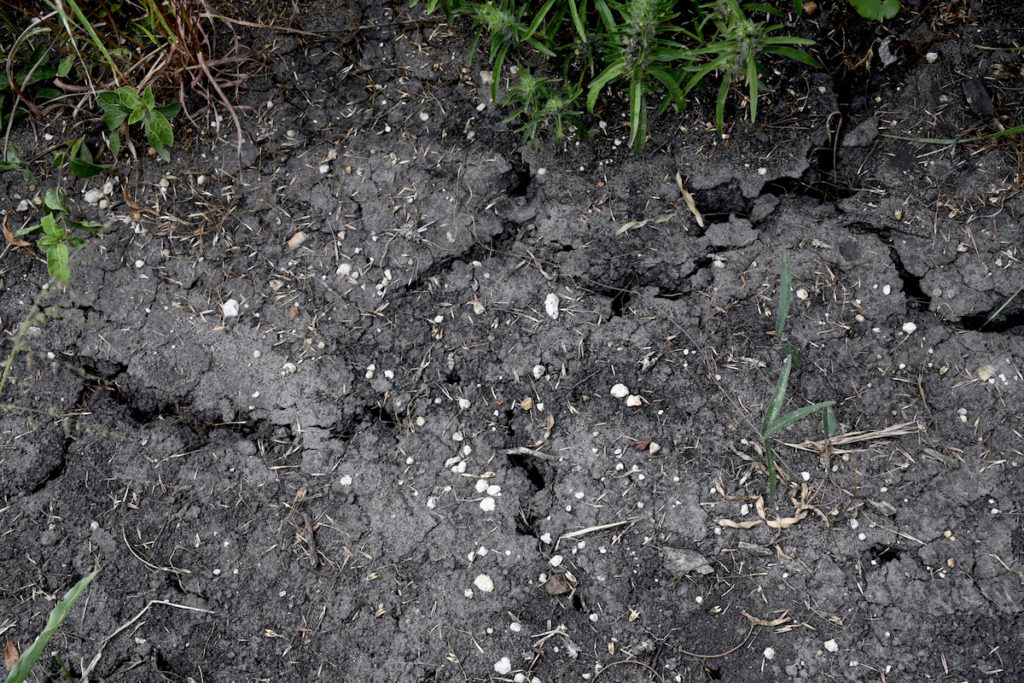
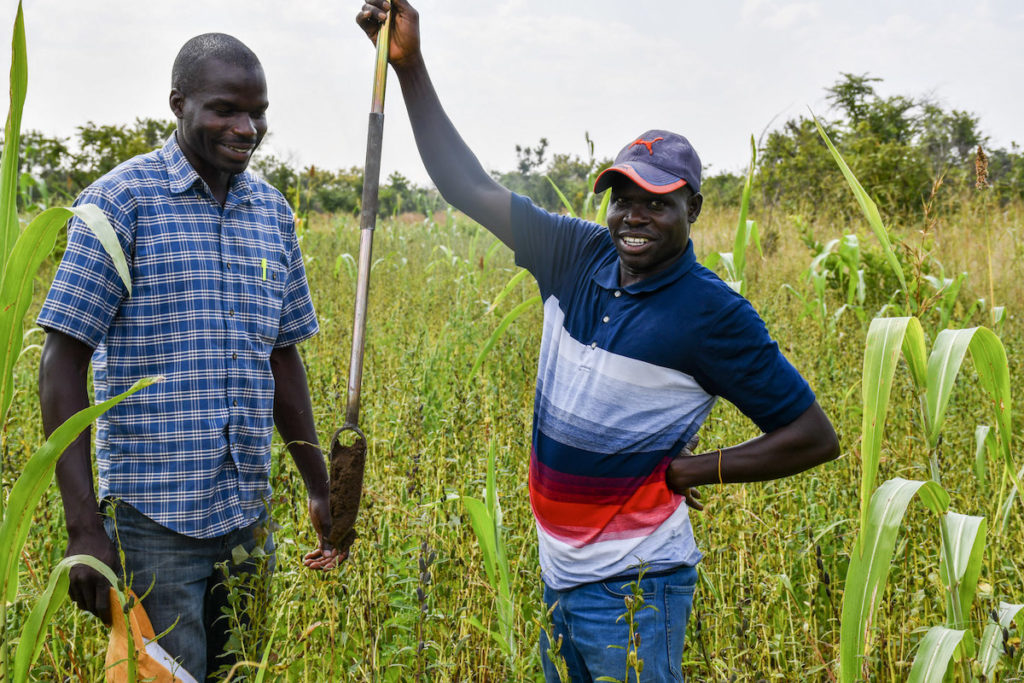
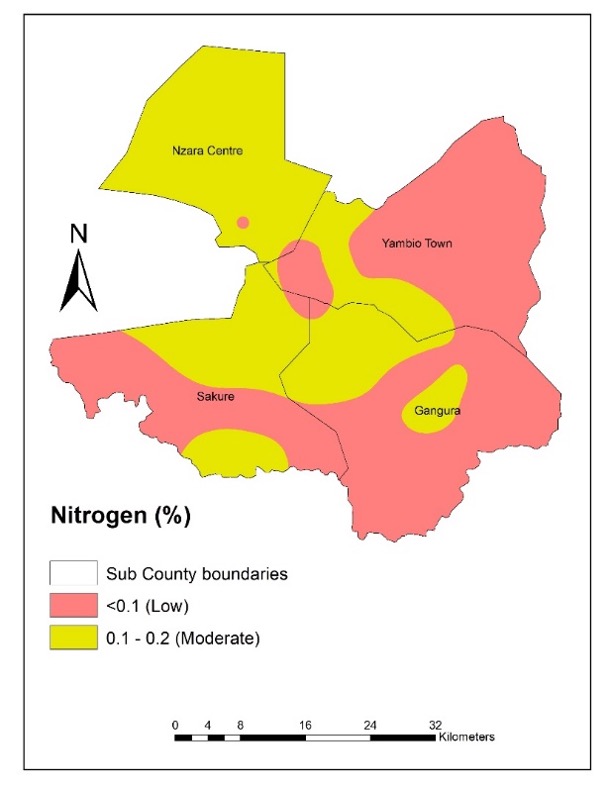
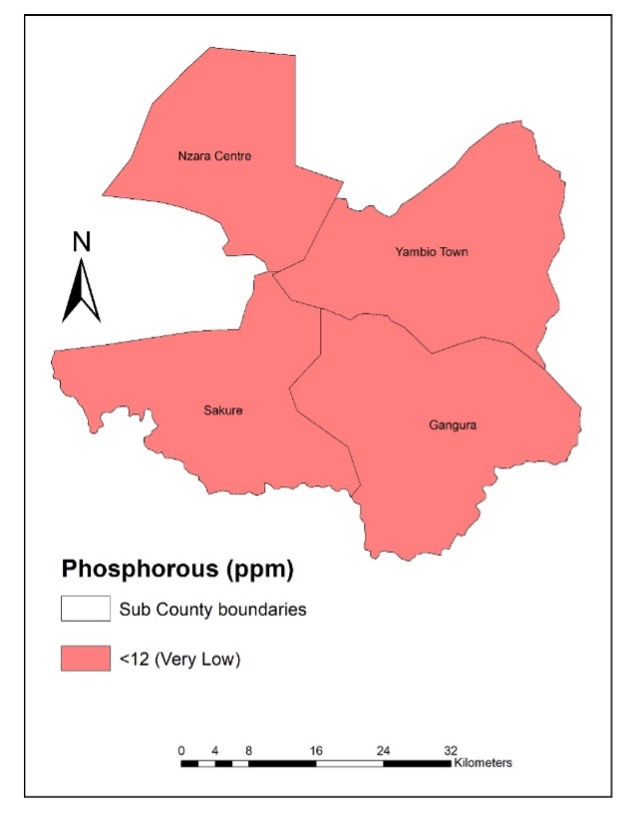
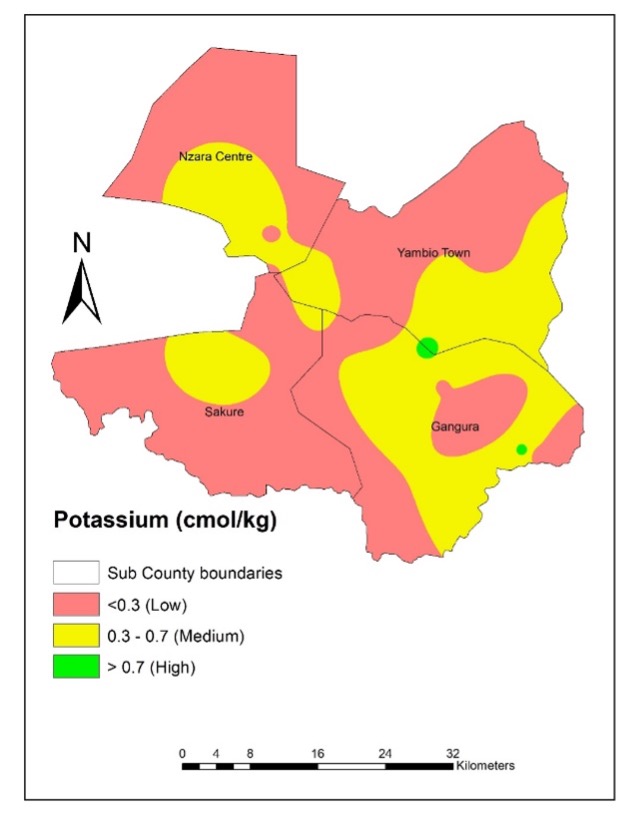
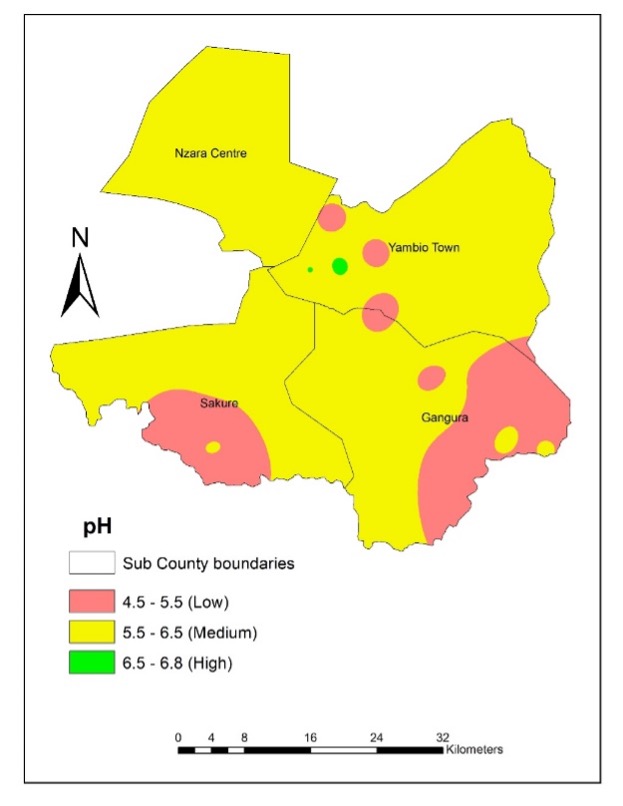
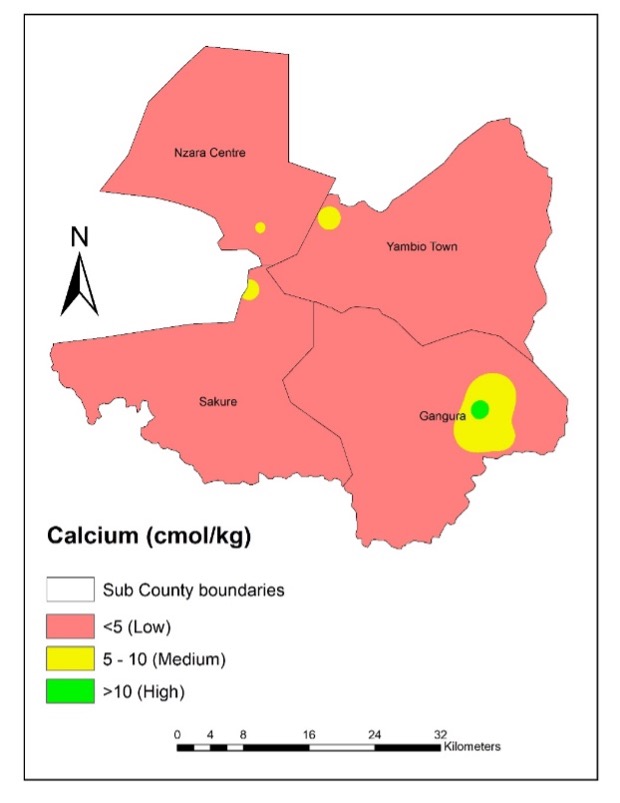
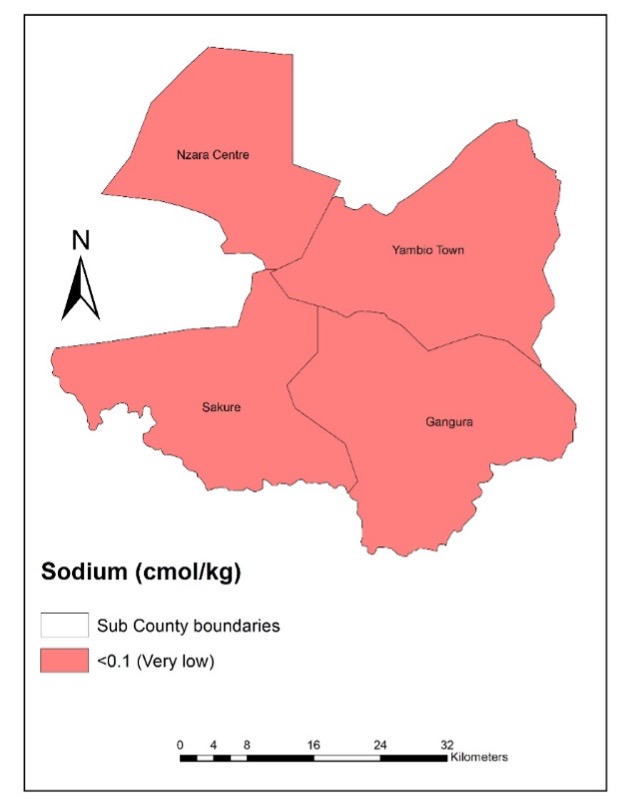
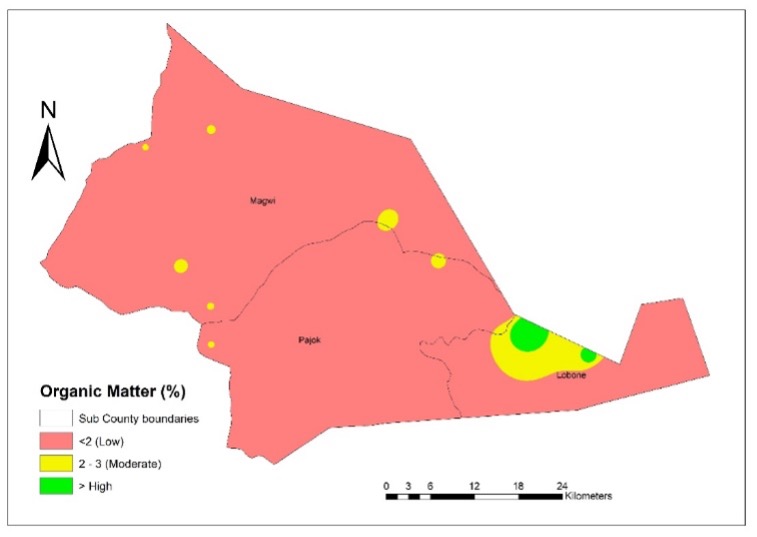
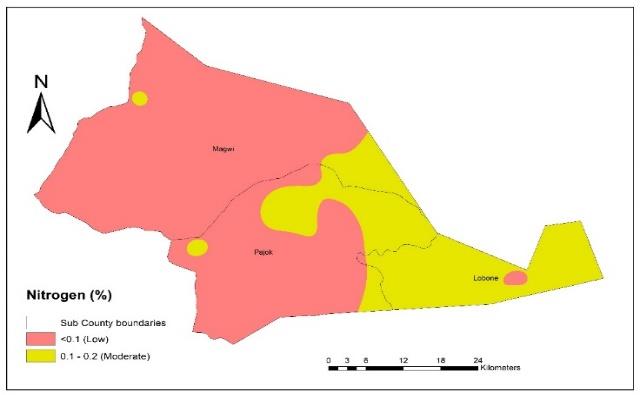
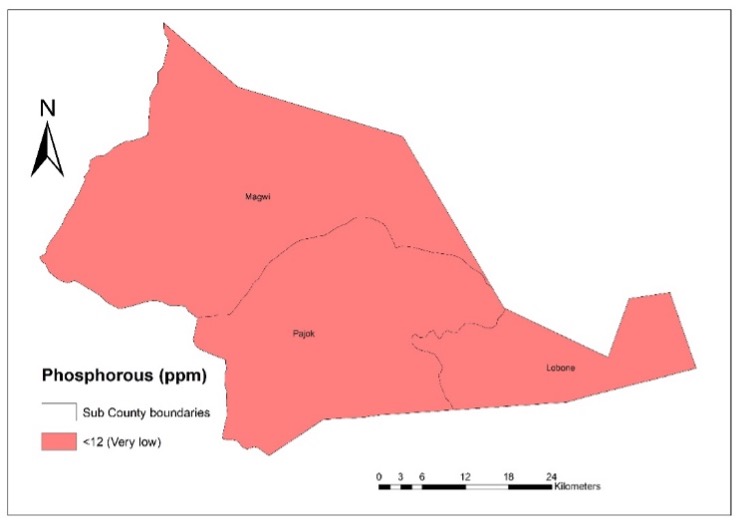
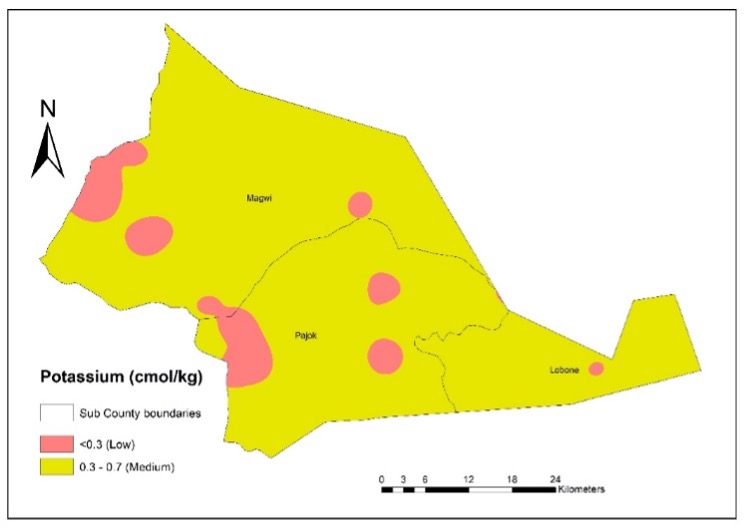
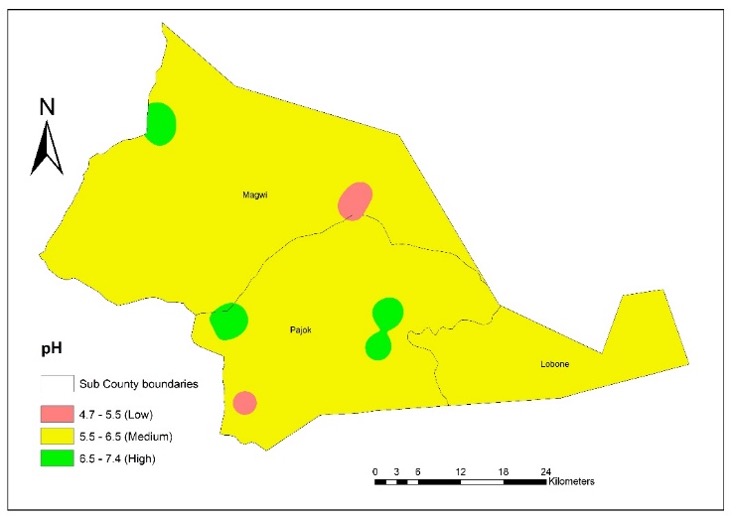
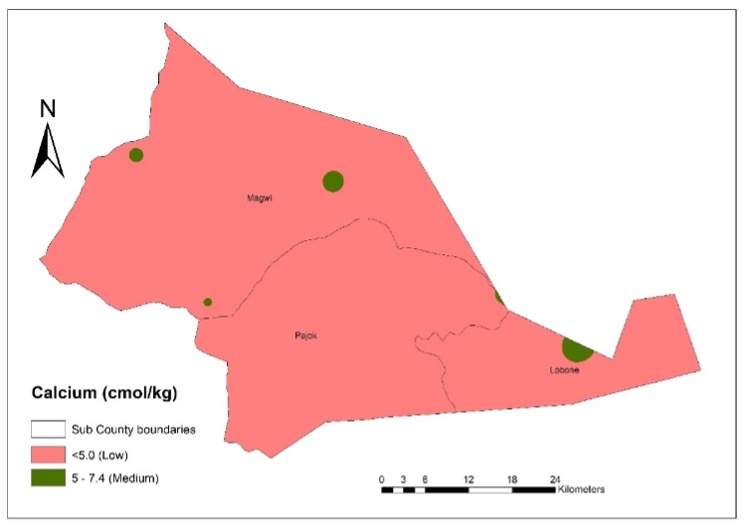
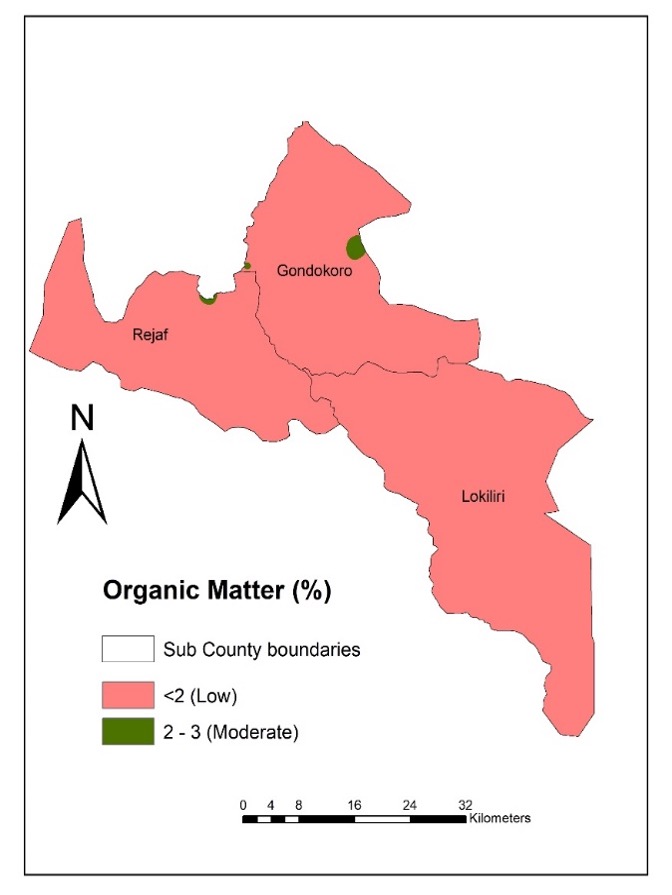
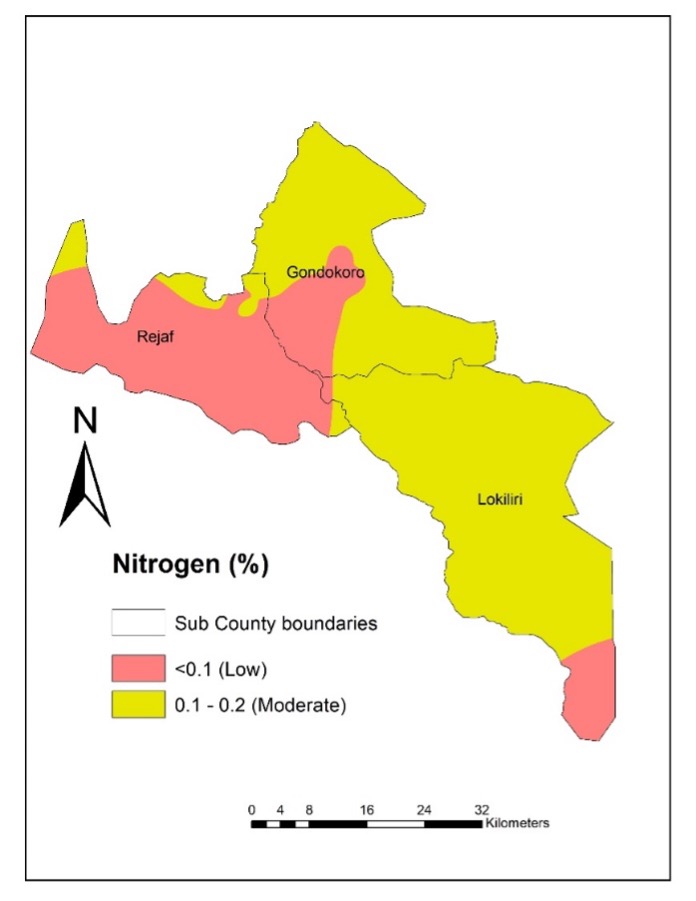
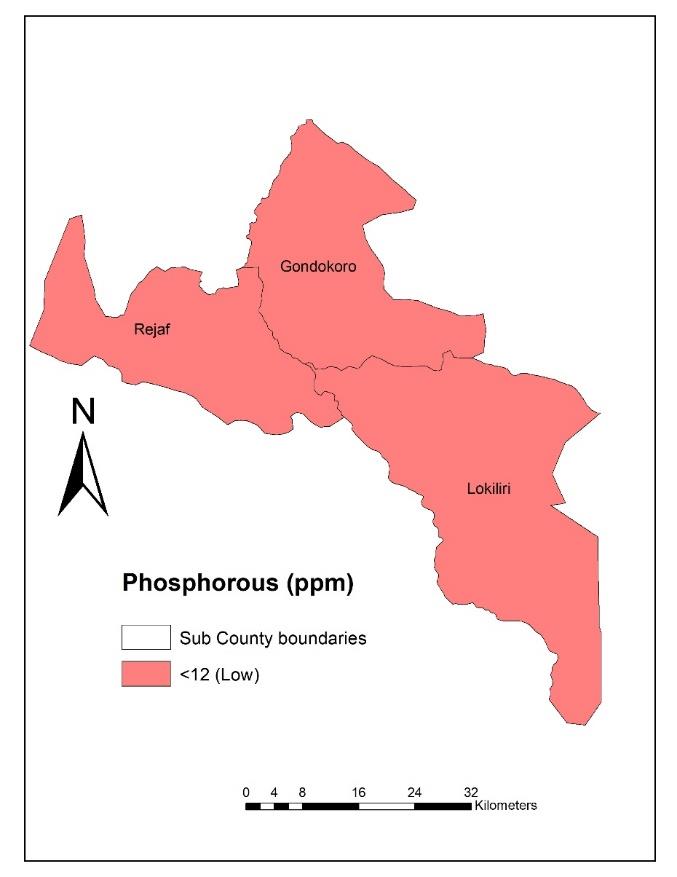
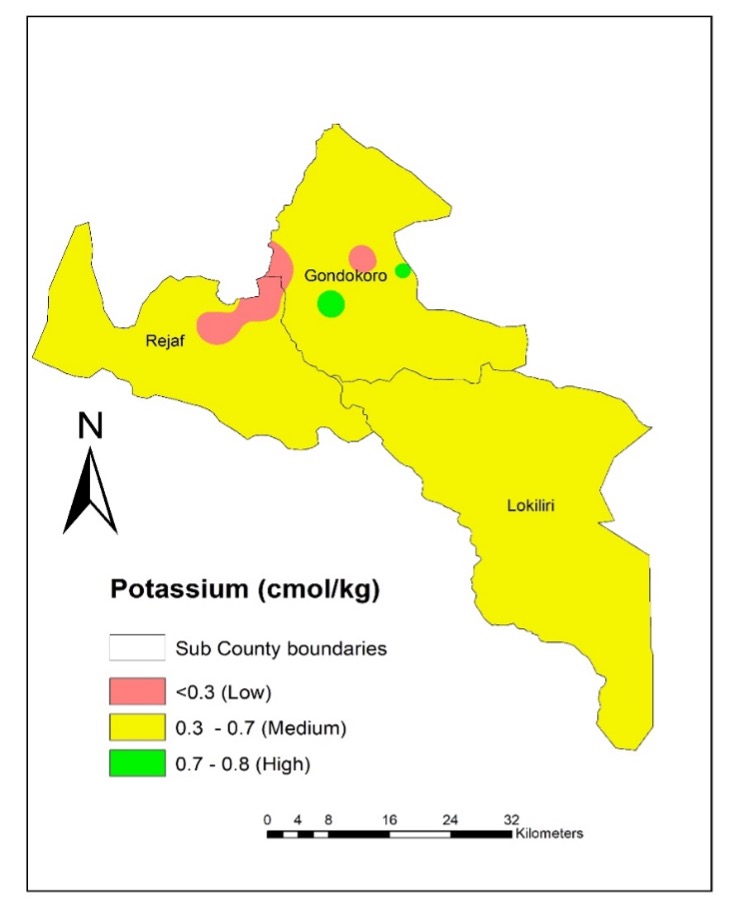
Soil samples were collected from 91 locations: 18 from Juba, 32 from Magwi, and 41 from Yambio. With the absence of a soil analysis laboratory in South Sudan, the soil samples were packaged, clearly labeled, and taken to Makerere University’s Department of Agricultural Production to be assessed in its Soil, Plant, and Water Analytical Laboratory. Each soil sampling point was georeferenced to aid the development of spatial nutrient maps. These samples were processed and analyzed for physical properties, such as texture, and chemical properties, such as soil pH, soil organic matter (SOM), nitrogen (N), phosphorous (P), potassium (K), calcium (Ca), and sodium (Na). Such an analysis is important for assessing the suitability of the soils for growing different crops. Generally, soil pH, Ca, and K were within the suitable range for most crops. However, SOM, N, and available P were all below the critical limit for most crops. The soil texture across the three counties is predominantly sandy loam to sandy clay loam.
The results from the analysis indicate that both N and P are low at less than 20 kilograms (kg) N ha-1 and less than 15 kg P ha-1 in these soils, and therefore, fertilizer recommendations should target meeting the crop requirement. For example, rice requires 75 kg N, 25 kg P2O5, and 25 kg K2O per hectare (ha-1) for a target yield of around 4 mt ha-1 under rainfed conditions. Thus, for optimum yields in the soils of the three states, a fertilizer application rate of at least 60 kg N ha-1 and 10 kg P2O5 ha-1 would be required.
Lead researcher, Dr. Emannuel Opolot, noted that soils are highly variable, and thus no single fertilizer will fit all situations. Practices such as integrated soil fertility management (ISFM) and conservation agriculture (CA) need to be introduced and promoted in these areas. ISFM recognizes farm variability as a first step and then integrates the use of improved seed and organic and mineral fertilizers to increase crop yields. Thus, a series of trainings on ISFM was organized for 97 extension workers from the government and seed-producing companies, who will further cascade these trainings to farmers through demonstration plots.
In addition, IFDC will continue to train farmers and extension workers on good agricultural practices, soil testing, use of certified seeds, and proper fertilizer selection and application as well as integrated pest management practices, all adapted to local farming conditions.
The following principles must be considered for ISFM to deliver results:
- Practices based solely on mineral fertilizers or solely on organic matter management are not sufficient for sustainable agricultural production.
- Well-adapted disease- and pest-resistant germplasm is necessary to make efficient use of available nutrients.
- Good agronomic practices in terms of planting date, planting density, and weeding are essential for ensuring the efficient use of nutrient resources.
For widespread adoption to occur, an enabling environment must be created through:
- Government policy should support fertilizer imports.
- Infrastructure (soil laboratory) for soil testing must be developed.
- An effective extension service should be able to deliver the technology to the farmers.
- A vibrant private sector must ensure efficient fertilizer and seed availability and distribution.
IFDC works closely with the national, state, and county Ministries of Agriculture to strengthen the capacity of government staff and share knowledge and information.
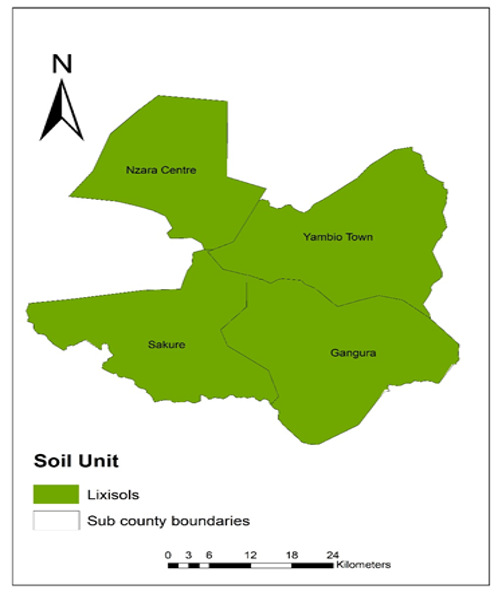
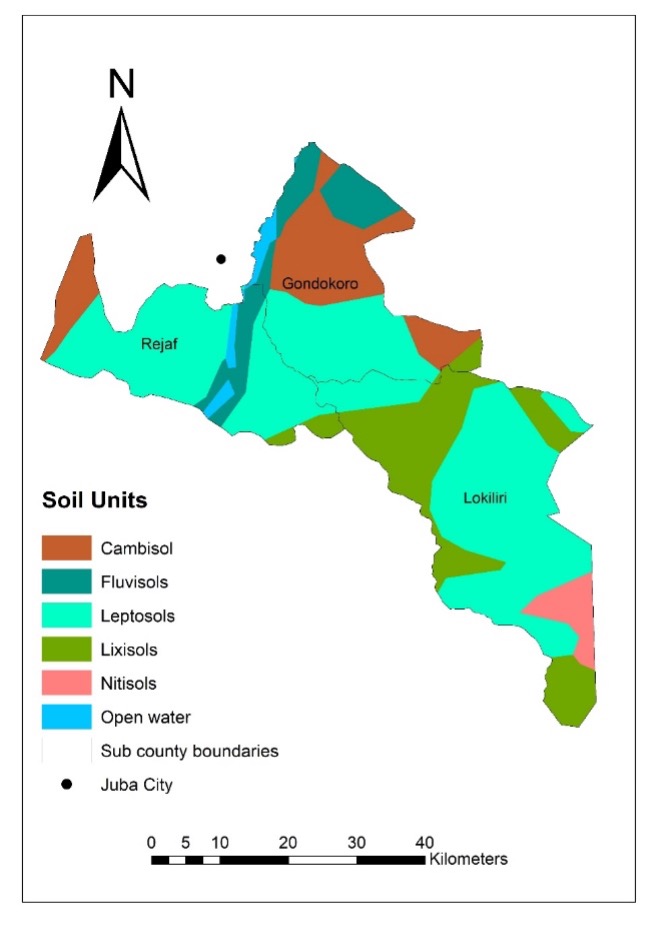
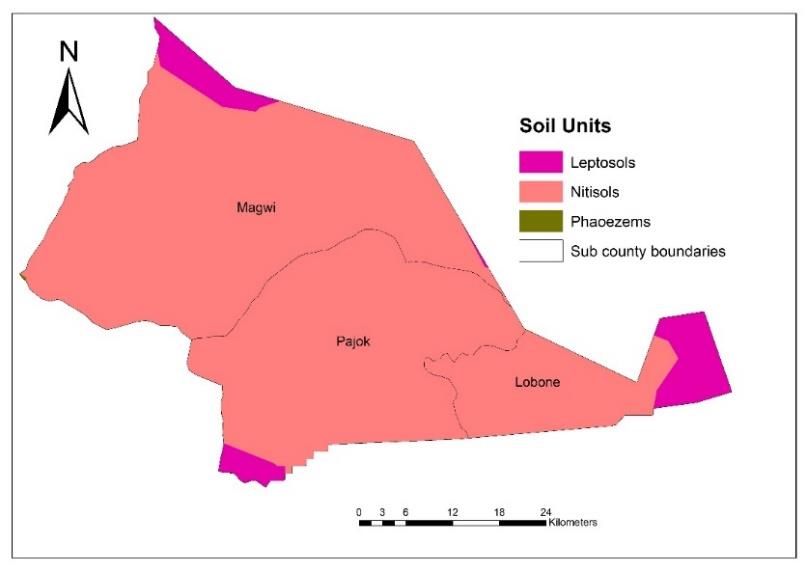
Soil and Nutrient Maps
- Maps showing soil units in Yambio, Juba, and Magwi Counties
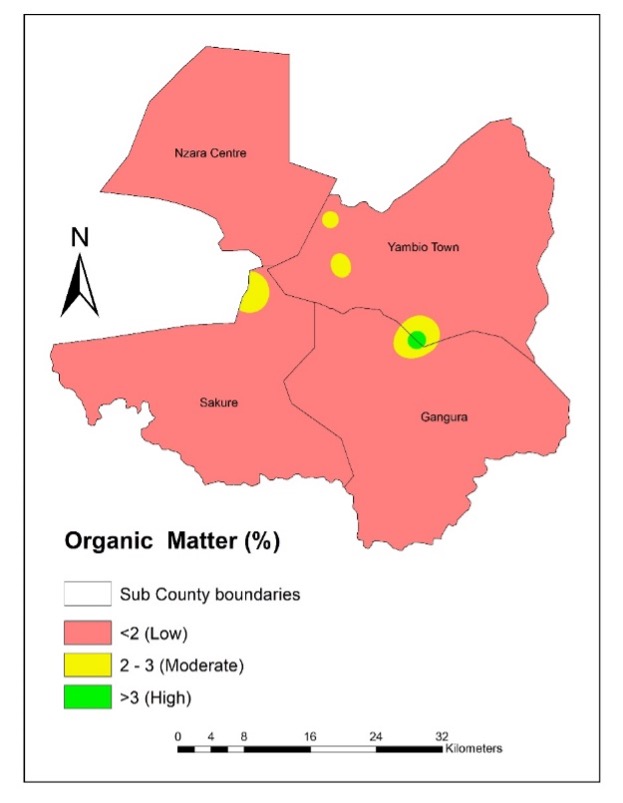
- Spatial maps showing the distribution of organic matter, nitrogen, phosphorus, and potassium in Yambio County
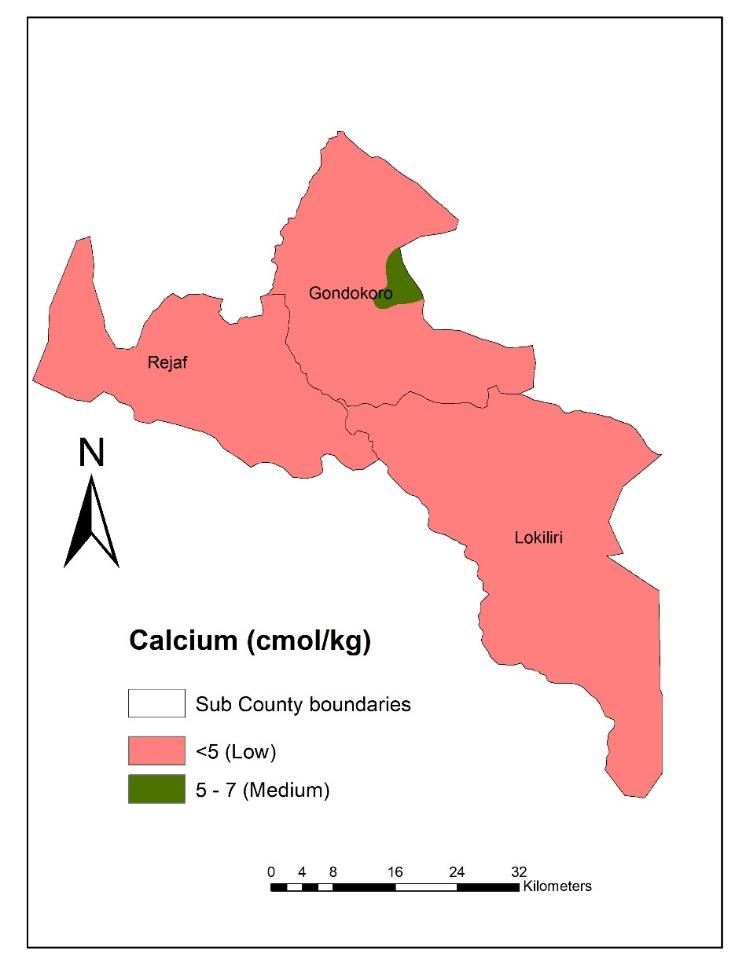
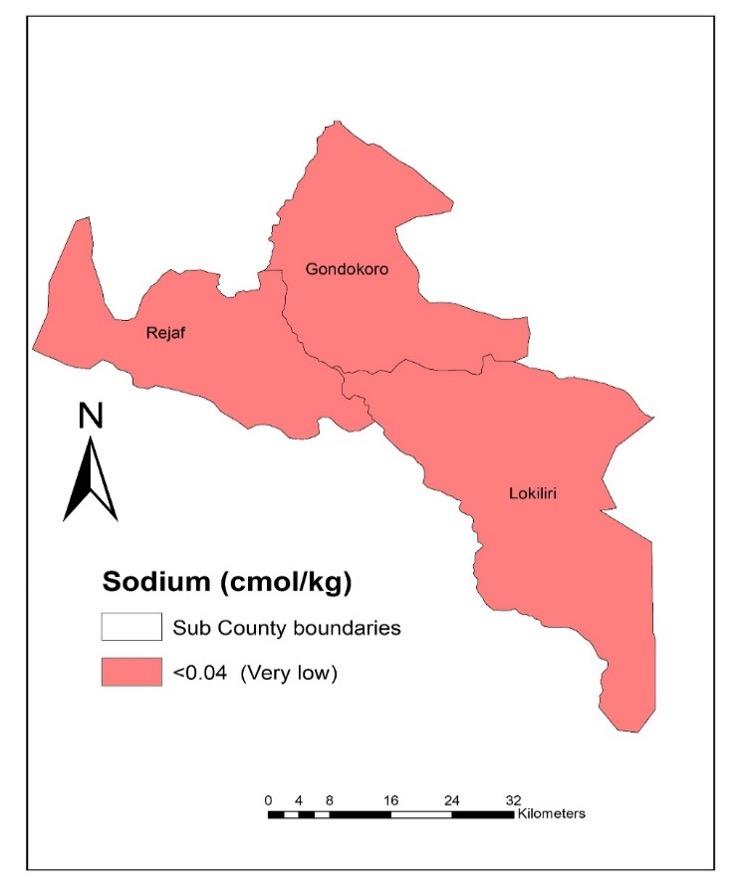
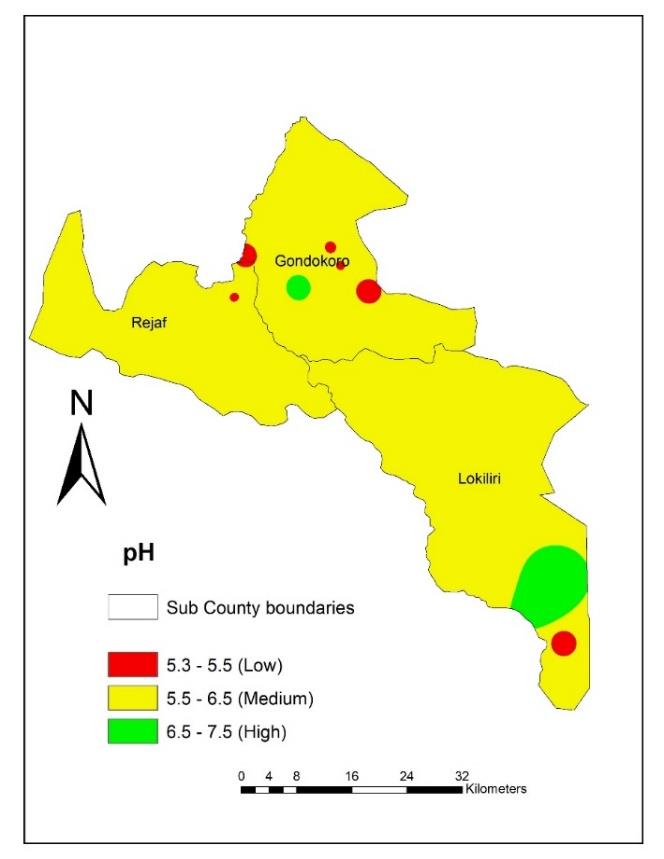
- Spatial maps showing the distribution of soil pH, calcium, and sodium in Yambio County
- Spatial maps showing the distribution of organic matter, nitrogen, phosphorous, potassium, soil pH, and calcium in Magwi County
- Spatial maps showing the distribution of organic matter, nitrogen, phosphorous, and potassium in Juba County
- Spatial maps showing the distribution of calcium, sodium, and soil pH in Juba County