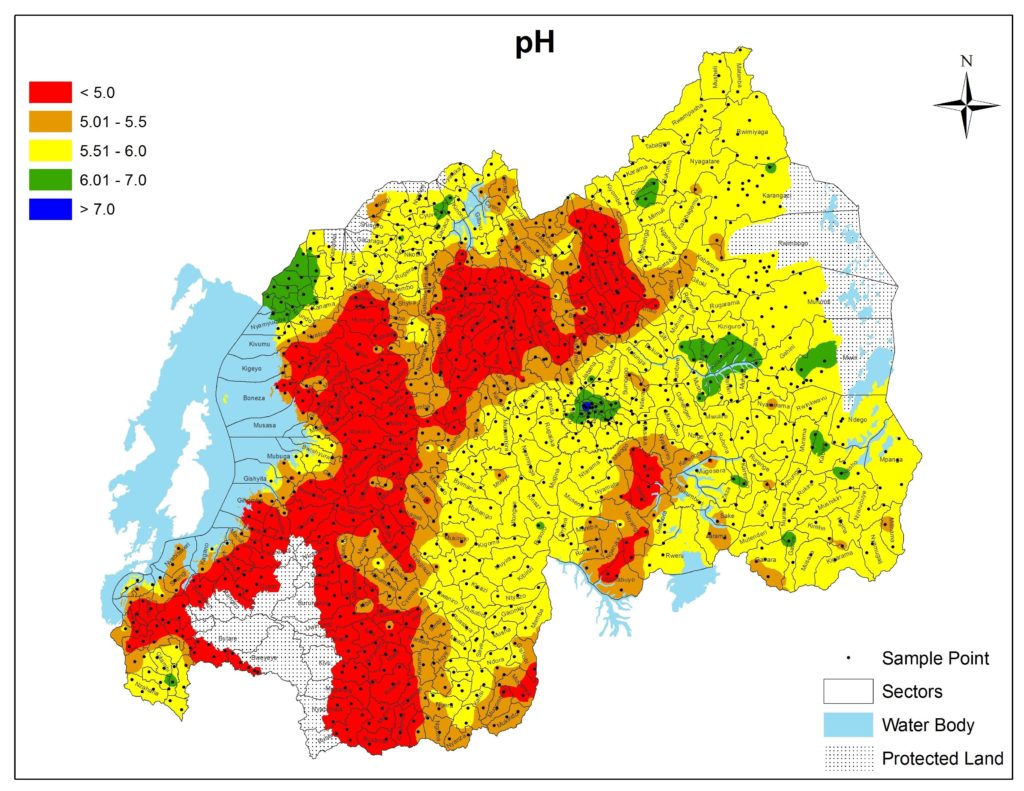
These maps show the levels of nutrients on a macro scale in respective countries and pH levels. Each map demonstrates soil needs, allowing for testing of appropriate fertilizer products and practices.
Available Maps
Burundi
Included Maps:
- Acid Saturation (%)
- Boron (ppm)
- Calcium (%)
- Calcium (ppm)
- Copper (ppm)
- Magnesium (%)
- Magnesium (ppm)
- Organic matter (%)
- pH
- Phosphorus (ppm)
- Potassium (%)
- Potassium (ppm)
- Sulphur (ppm)
- Zinc (ppm)
These maps were developed in partnership with the Institut des Sciences Agronomiques du Burundi (ISABU).
Rwanda
Included Maps:
- Acid Saturation (%)
- AcidSat
- Boron (ppm)
- Calcium (%)
- Calcium (ppm)
- Copper (ppm)
- Magnesium (%)
- Magnesium (ppm)
- Manganese (ppm)
- Manganese
- Organic Matter (%)
- pH
- Phosphorous (ppm)
- Potassium (%)
- Potassium (ppm)
- Sulphur (ppm)
- Zinc (ppm)
Uganda
Included Maps:
- Boron (ppm)
- Copper (ppm)
- Organic Matter (%)
- pH
- Phosphorus (ppm)
- Potassium (ppm)
- Sulfur (ppm)
- Zinc (ppm)