Data-Driven Fertilizer Recommendations for Sub-Saharan Africa
Optimized Fertilizer Recommendations in Africa (OFRA) helps farmers across Sub-Saharan Africa maximize returns on fertilizer investments while increasing yields, sustaining or improving soil fertility, and protecting the environment.
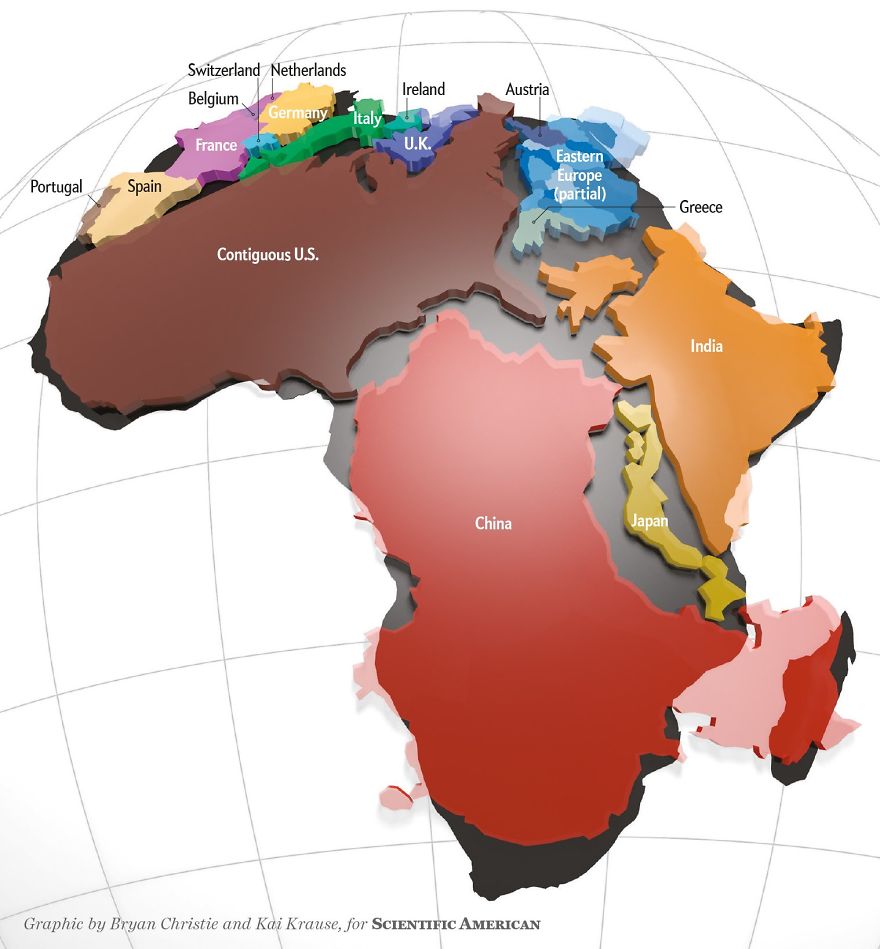
To reflect the true scale of this work, the Christie and Krause map (Figure 1) illustrates Africa’s actual size, which is often de-emphasized in typical world map projections.
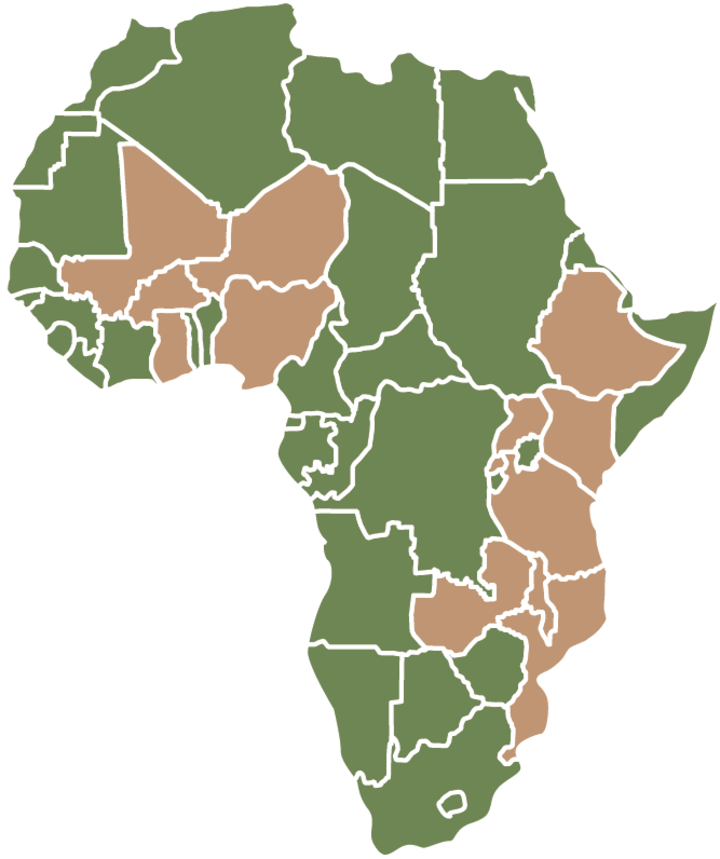
With scientific support from the University of Nebraska–Lincoln, the AGRA-Soil Health Program (SHP)–funded OFRA project managed by CABI in Nairobi builds on earlier work in Uganda and now serves 67 prime agricultural ecozones (AEZs) across 13 Sub-Saharan African countries (Figure 2).
For each of the 67 AEZs, crop–nutrient response functions have been established using results from both past and recent field research. Each AEZ’s fertilizer recommendations are developed from a data subset derived from research results from similar crop growing conditions as in a given AEZ, known as the AEZ’s “inference space.”
These data subsets are analyzed to generate representative response functions, which are then incorporated into each AEZ’s Excel-based Fertilizer Optimization Tool (FOT). Using linear optimization, the FOT re-iteratively evaluates multiple response functions to generate fertilizer recommendations tailored to farmers’ crop choices, land allocation, fertilizer prices, grain values, and overall fertilizer budget constraints.
Fertilizer Optimization Tools for Digital Use and Offline Use
To ensure accessibility where computers are unavailable, paper-based FOTs have been developed for each AEZ. These tools provide guidance on fertilizer product selection; application rates, timing, and methods; and include instructions for farmer-led calibration to achieve uniform and accurate application. Fertilizer use calibration tools are also available.
Additionally, the OFRA Response Function Dataset, contains more than 6,200 georeferenced crop–nutrient response functions along with supporting information.
View and download the full suite of OFRA tools below to access data-driven fertilizer recommendations
OFRA Book
Chapter 1: Principles and Approaches
Chapter 3: ISFM in Sub-Saharan Africa
Chapter 17: Enabling Optimization
Excel Fertilizer Optimization Tools
ET Cold to v cold sub-Afro-alphine 31 Mar 16
ET Hot to warm moist lowlands S9 degrees 31 Mar 16
ET Hot to warm sub moist and drier Less than 1000m 31 Mar 16
ET Hot to Warm sub moist and drier lowlands_1000 1800m 31 Mar 16
ET Tepid to cold humid mid highland 1700 2200 31 Mar 16
ET Tepid to cold humid mid highland 2000 2700 m 31 Mar 16
ET Tepid to cold moist midhighland 1700-2200m 31 Mar 16
ET Tepid to cold moist midhighland 2000 to 2700 MASL 31 Mar 16
ET Tepid to cold sub humid mid highland 1700 2200 m 31 Mar 16
ET Tepid to cold sub humid midhighlands 2000 2700m 31 Mar 16
ET Tepid to cold sub moist mid highlands 1700 2200 m 31 Mar 16
ET Tepid to cold sub moist mid highlands 2000 2700m 31 Mar 16
Kenya Eastern above 1200 m 28 feb 2019
Kenya Eastern below 1300 m 28 nov 16
Kenya Rift Valley above 2000 CAN Feb 19
Kenya Rift Valley above 2000 UreaDAP fEB 19
Kenya Rift Valley below 2300 CAN2323 Feb 19
Kenya Rift Valley below 2300 UreaDAP Feb 19
Kenya Western above 1400 CAN2323 Feb 19
Kenya Western above 1400 UreaDAP Feb 19
Uganda FOT- Central LVC August 2016
Uganda FOT- Kapchorwa Farmlands August 2016
Uganda FOT- Kapchorwa Farmlands – Eastern Highlands above 1800 August 2016
Uganda FOT- Mt. Elgon Farmlands (Eastern Highland 1400 – 1800masl) August 2016
Uganda FOT- Northern moist and mid western Altitute Farmlands August 2016
Uganda FOT- South Lake Kyoga Basin August 2016
Uganda FOT- South Lake Kyoga Basin II (lowland rice and sorghum) August 2016
Uganda FOT- South Lake Kyoga Basin III (millet & upland rice) August 2016
Uganda FOT- South Lake Kyoga Basin IV (Lowland rice) August 2016
Uganda FOT-SW Highland (1400 – 1800) August 2016
Uganda FOT-SW Highland above 1800m Kabale – Rukungiri, Kabale – Kisoro August 2016
Paper Fertilization Tools
Ethiopia paper FOT 1 C to VCsAfro Alpine above 2,500 5 Apr 2016
Ethiopia paper FOT 3 T t CHmH 1700 27005 Apr 2016
Ethiopia paper FOT 4 T t CHmH 200 2700m 5 Apr 2016
Ethiopia paper FOT 5 Tepid to cold humid mid high lands Elevation 1700
Ethiopia paper FOT 6 T t CMmH 2000 2700m 5 Apr 2016
Ethiopia paper FOT 7 T t CsHmH 2000 2700m 5 Apr 2016
Ethiopia paper FOT 8 T t CsMmH 2000 2700m 5 Apr 2016
Ethiopia paper FOT 9 HWM low land 9N 4 Mar 2016
Ethiopia paper FOTs 10 H t WsM and dry Lowland below 1000m 4 Mar 2016
Ethiopia paper FOTs 11 H t WsM and drier lowlands 1000 (1000 1800)4 Apr 2016
Ethiopia paper FOT 12 Cool to Tepid Sub-moist 1700 2200 m 4 Mar 2016
Ethiopia paper FOTS13 Cool to Tepid Sub-moist 2000 2700 m 5 Apr 2016
Kenya Central paper FOT 18 Nov DAP CAN 2016
Kenya Central paper FOT 18 Nov Urea 2016
Kenya Coastal paper FOT 18 Nov 2016
Kenya Eastern lower paper FOT 18th Nov DAP CAN 2016
Kenya Eastern lower paper FOT 18th Nov Urea 2016
Kenya Eastern upper paper FOT 22 Nov Urea 2016
Kenya Rift valley upper FOT_ 19 Feb 2018
Kenya Rift Valley lower paper FOT 15 Feb2018
Fertilizer Use Calibration Tools
OFRA Audio-Visuals
Fertilizer Management and Soil Acidification
Nutrient Management and Fertilizer Principles
OFRA Fertilizer Use Decision Tools
Principles of Optimizing Fertilizer Use
OFRA Response Function Data Set
OFRA-Response-Function-Dataset-Nov-16-2023